
First look at the year, not the color
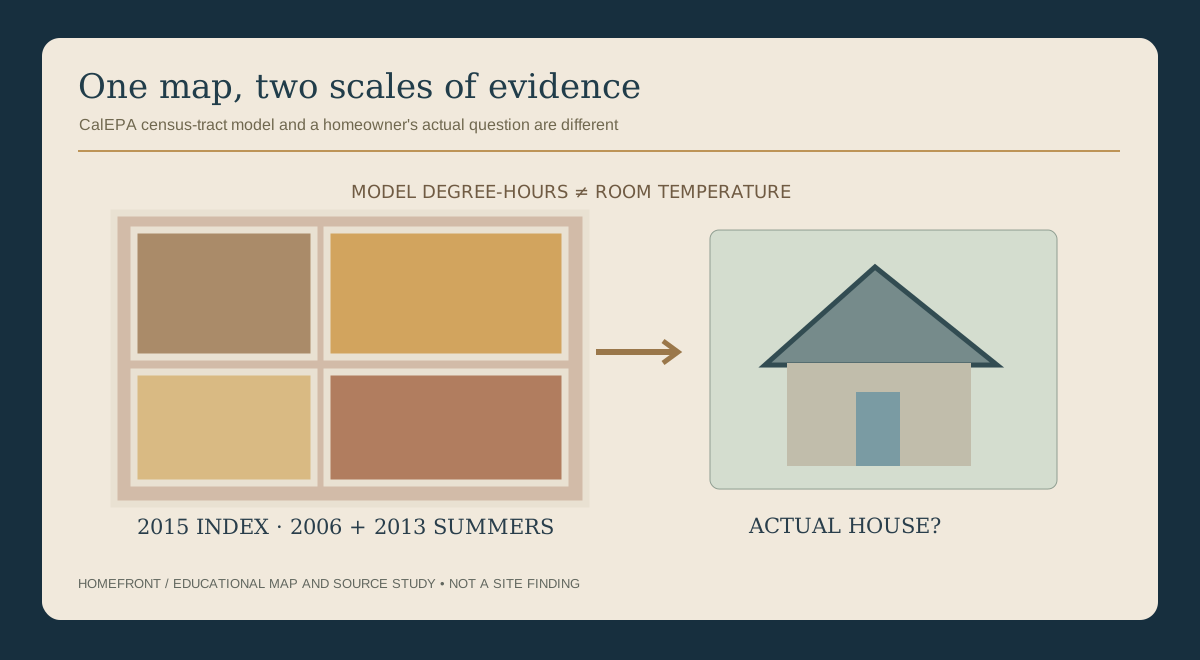
CalEPA published its Urban Heat Island Index research in 2015 using atmospheric simulations of 182 warm-season days from 2006 and 2013. The model compares air temperature around two meters above ground in urban census tracts with nearby upwind rural reference points; it does not describe today's temperature inside an individual home.
If someone shows you a deep red census tract and promises that a specific roof coating will lower the temperature of your bedroom, they have skipped several steps. A modeled tract-scale index cannot identify why a particular room feels warm or guarantee savings for a certain product.
Source notes: TB-CAEPA-HEAT, TB-CAEPA-HEAT-MAP, TB-CAEPA-HEAT-REPORT
The map legend in plain English
| Map element | A reasonable interpretation | The tempting wrong interpretation |
|---|---|---|
| Census tract outline | The map divides urban areas into census tracts for its modeled analysis | Every address inside has identical shade, materials or air temperature |
| Heat-island index intensity | Modeled urban-minus-upwind-rural air-temperature differences accumulated hourly, shown in the map as cumulative degree-hours (UHII) and as Celsius degree-hours per day (DegHourDay). | The actual air temperature of one street or the inside of your home |
| Colors across neighboring tracts | The model indicates relative differences across the studied area | A current ranking of which roof or yard is most uncomfortable |
| 2015 publication, 2006 and 2013 simulations | These are dated study years, not a 2015 forecast or present-day monitor. | A 2026 home inspection or an NWS heat warning. |
Source notes: TB-CAEPA-HEAT, TB-CAEPA-HEAT-MAP
A source trail for a curious homeowner
Write the exact source
Keep the original research publication year (2015), modeled summers (2006 and 2013) and the exact map legend displayed.
Identify the census tract and legend
Identify the census tract, whether the display says UHII or DegHourDay, and its associated units. A tract-level index is not a measurement for any one address.
Note what happens at your home
Write the date and time a path, room or yard space feels uncomfortable, without turning it into a measured thermal result.
Choose one real decision
Is the question about outdoor seating, a roof proposal, or why an upstairs room feels different? Keep those separate.
Assign the missing answer
Let an appropriately qualified building or landscape professional evaluate the property, not a census-tract model.
Put current heat safety first
Do not go outdoors to record observations during an NWS heat advisory or warning. Follow current official warnings and public-health guidance instead of using the historical map as an all-clear.
Why a degree-hour is not a degree
CalEPA's historical modeled Urban Heat Island Index (UHII) sums hourly urban-versus-upwind-rural temperature differences across the 182 modeled days, in Celsius degree-hours; dividing that sum by 182 gives degree-hours per day. Two modeled degrees for four hours contribute eight degree-hours; this is neither an eight-degree temperature change nor a home measurement. CalEPA's interactive map page notes that since 2020 it has additionally displayed this per-day measure as DegHourDay.
Even if the source correctly describes a regional heat effect, the household still needs to separate outdoor pavement exposure, shading, room comfort and known building details. Those are different kinds of information.
Source notes: TB-CAEPA-HEAT-MAP
Questions when someone cites a 'cooler neighborhood' project
Is this a research map or a current weather service?
A historical Urban Heat Island Index does not replace National Weather Service heat information.
What does the study measure?
Look for the census-tract model and its unit rather than a marketing temperature claim.
Which evidence belongs to this particular house?
A roof's current condition and a room's comfort problem need actual evaluation.
What part of a proposal would change the experience?
Ask for stated assumptions, connected systems and realistic limitations rather than guaranteed percentages.
Use community research at the right scale
Public heat-island maps can support local understanding of trees, vegetation and land-use planning. They help explain why communities consider shade, public surfaces and greener outdoor spaces, including in Los Angeles and Inland Empire cities.
For home decisions, go back to the site. A public map should make a homeowner better at asking questions, not overconfident about the next purchase.